Example Datasets
Download, preview, and query example datasets for use in cartoframes examples. Try examples by running the notebooks in binder, or trying the Example Datasets notebook.
In addition to the functions listed below, this examples module provides a
CartoContext that is
authenticated against all public datasets in the https://cartoframes.carto.com
account. This means that besides reading the datasets from CARTO, users can
also create maps from these datasets.
For example, the following will produce an interactive map of poverty rates in census tracts in Brooklyn, New York (preview of static version below code).
from cartoframes.examples import example_context
from cartoframes import Layer
example_context.map(Layer('brooklyn_poverty', color='poverty_per_pop'))

To query datasets, use the CartoContext.query method. The following example finds
the poverty rate in the census tract a McDonald’s fast food joint is located
(preview of static map below code).
from cartoframes.examples import import example_context

# query to get poverty rates where mcdonald's are located in brooklyn
q = '''
    SELECT m.the_geom, m.cartodb_id, m.the_geom_webmercator, c.poverty_per_pop
    FROM mcdonalds_nyc as m, brooklyn_poverty as c
    WHERE ST_Intersects(m.the_geom, c.the_geom)
'''
# get data
df = example_context.query(q)

# visualize data
from cartoframes import QueryLayer
example_context.map(QueryLayer(q, size='poverty_per_pop'))
To write datasets to your account from the examples account, the following is a good method:
from cartoframes import CartoContext
from cartoframes.examples import read_taxi
USERNAME = 'your user name'
APIKEY = 'your API key'
cc = CartoContext(
    base_url='https://{}.carto.com'.format(USERNAME),
    api_key=APIKEY
)
cc.write(
    read_taxi(),
    'taxi_data_examples_acct',
    lnglat=('pickup_latitude', 'pickup_longitude')
)
Data access functions
-
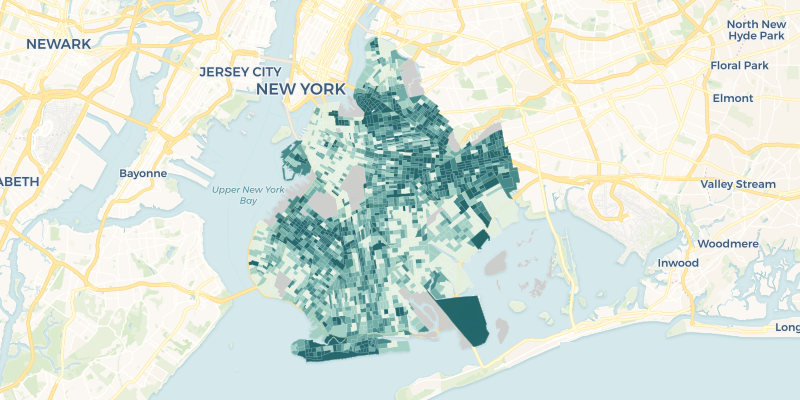
cartoframes.examples.read_brooklyn_poverty(limit=None, **kwargs)¶ Read the dataset brooklyn_poverty into a pandas DataFrame from the cartoframes example account at https://cartoframes.carto.com/tables/brooklyn_poverty/public This dataset contains poverty rates for census tracts in Brooklyn, New York
The data looks as follows (styled on poverty_per_pop):
Parameters: - limit (int, optional) – Limit results to limit. Defaults to return all rows of the original dataset
- **kwargs – Arguments accepted in
CartoContext.read
Returns: Data in the table brooklyn_poverty on the cartoframes example account
Return type: pandas.DataFrame
Example:
from cartoframes.examples import read_brooklyn_poverty
df = read_brooklyn_poverty()
-
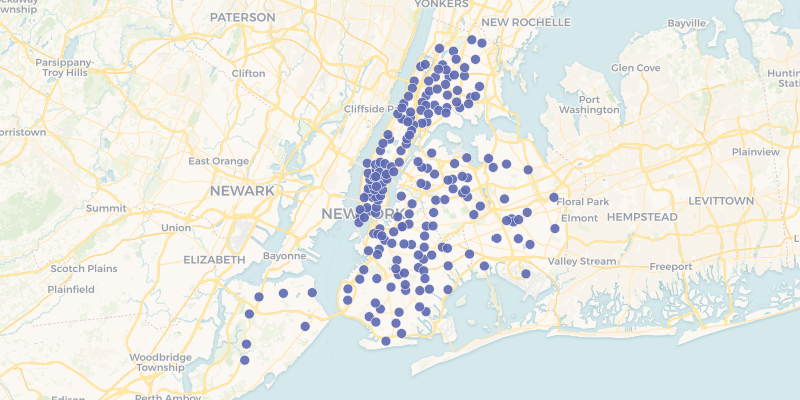
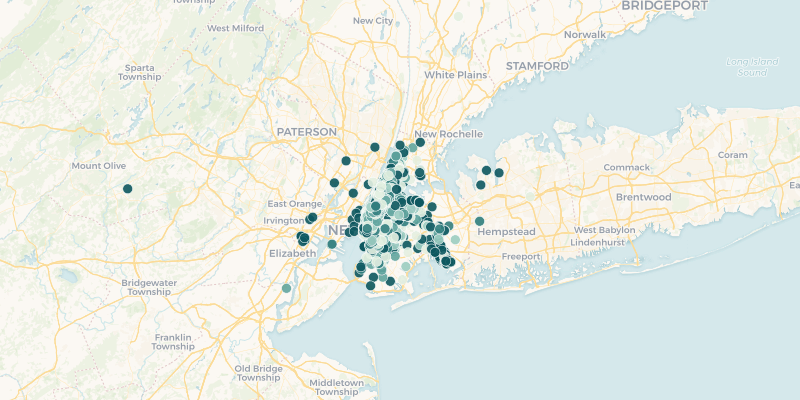
cartoframes.examples.read_mcdonalds_nyc(limit=None, **kwargs)¶ Read the dataset mcdonalds_nyc into a pandas DataFrame from the cartoframes example account at https://cartoframes.carto.com/tables/mcdonalds_nyc/public This dataset contains the locations of McDonald’s Fast Food within New York City.
Visually the data looks as follows:
Parameters: - limit (int, optional) – Limit results to limit. Defaults to return all rows of the original dataset
- **kwargs – Arguments accepted in
CartoContext.read
Returns: Data in the table mcdonalds_nyc on the cartoframes example account
Return type: pandas.DataFrame
Example:
from cartoframes.examples import read_mcdonalds_nyc
df = read_mcdonalds_nyc()
-
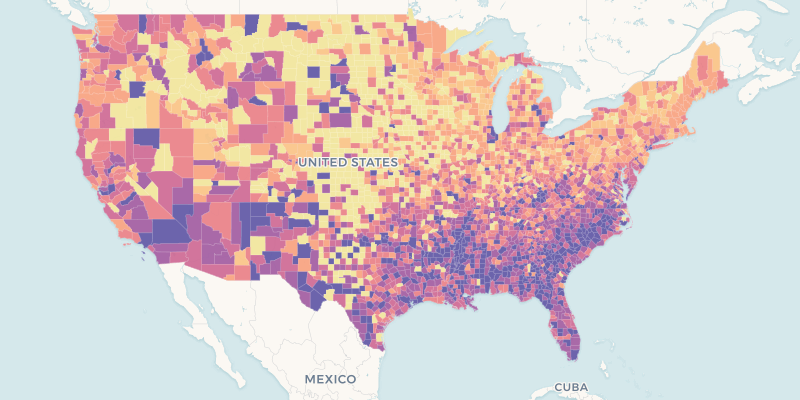
cartoframes.examples.read_nat(limit=None, **kwargs)¶ Read nat dataset: US county homicides 1960-1990
This table is located at: https://cartoframes.carto.com/tables/nat/public
Visually, the data looks as follows (styled by the hr90 column):
Parameters: - limit (int, optional) – Limit results to limit. Defaults to return all rows of the original dataset
- **kwargs – Arguments accepted in
CartoContext.read
Returns: Data in the table nat on the cartoframes example account
Return type: pandas.DataFrame
Example:
from cartoframes.examples import read_nat
df = read_nat()
-
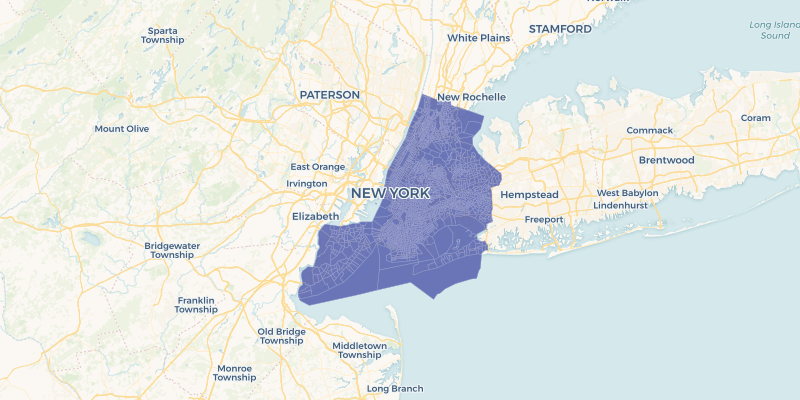
cartoframes.examples.read_nyc_census_tracts(limit=None, **kwargs)¶ Read the dataset nyc_census_tracts into a pandas DataFrame from the cartoframes example account at https://cartoframes.carto.com/tables/nyc_census_tracts/public This dataset contains the US census boundaries for 2015 Tiger census tracts and the corresponding GEOID in the geom_refs column.
Visually the data looks as follows:
Parameters: - limit (int, optional) – Limit results to limit. Defaults to return all rows of the original dataset
- **kwargs – Arguments accepted in
CartoContext.read
Returns: Data in the table nyc_census_tracts on the cartoframes example account
Return type: pandas.DataFrame
Example:
from cartoframes.examples import read_nyc_census_tracts
df = read_nyc_census_tracts()
-
cartoframes.examples.read_taxi(limit=None, **kwargs)¶ Read the dataset taxi_50k into a pandas DataFrame from the cartoframes example account at https://cartoframes.carto.com/tables/taxi_50k/public. This table has a sample of 50,000 taxi trips taken in New York City. The dataset includes fare amount, tolls, payment type, and pick up and drop off locations.
Note
This dataset does not have geometries. The geometries have to be created by using the pickup or drop-off lng/lat pairs. These can be specified in CartoContext.write.
To create geometries with example_context.query, write a query such as this:
example_context.query('''
    SELECT
      CDB_LatLng(pickup_latitude, pickup_longitude) as the_geom,
      cartodb_id,
      fare_amount
    FROM
      taxi_50
''')
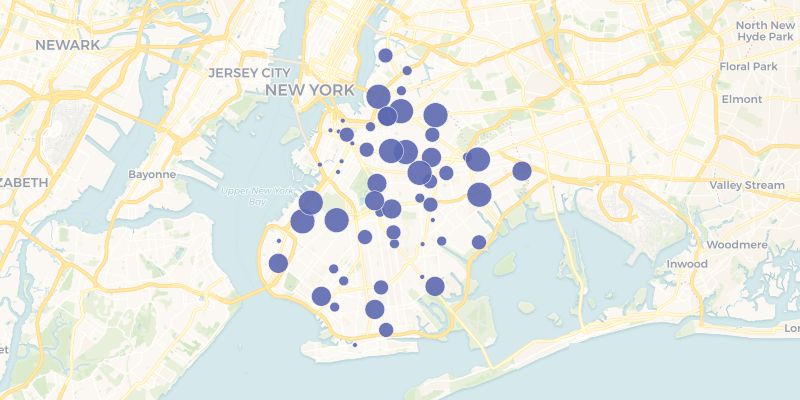
The data looks as follows (using the pickup location for the geometry and styling by fare_amount):
Parameters: - limit (int, optional) – Limit results to limit. Defaults to return all rows of the original dataset
- **kwargs – Arguments accepted in
CartoContext.read
Returns: Data in the table taxi_50k on the cartoframes example account
Return type: pandas.DataFrame
Example:
from cartoframes.examples import read_taxi
df = read_taxi()
Example CartoContext
-
class
cartoframes.examples.Examples¶ A CartoContext with a CARTO account containing example data. This special
CartoContextprovides read access to all the datasets in the cartoframes CARTO account.The recommended way to use this class is to import the example_context from the cartoframes.examples module:
from cartoframes.examples import example_context
df = example_context.read_taxi()
The following tables are available for use with the
CartoContext.read,CartoContext.map, andCartoContext.querymethods.brooklyn_poverty- basic poverty information for Brooklyn, New Yorkmcdonalds_nyc- McDonald’s locations in New York Citynat- historical USA-wide homicide rates at the county levelnyc_census_tracts- Census tract boundaries for New York Citytaxi_50k- Taxi trip data, including pickup/drop-off locations. This table does not have an explicit geometry, so one must be created from the pickup_latitude/pickup_longitude columns, the dropoff_latitude/dropoff_longitude columns, or through some other process. When writing this table to your account, make sure to specify the lnglat flag inCartoContext.write
Besides the standard
CartoContextmethods, this class includes a convenience method for each of the tables listed above. See the full list below.-
read_brooklyn_poverty(limit=None, **kwargs)¶ Poverty information for Brooklyn, New York, USA. See the function
read_brooklyn_povertyfor more information.Example:
from cartoframes.examples import example_context
df = example_context.read_brooklyn_poverty()
-
read_mcdonalds_nyc(limit=None, **kwargs)¶ McDonald’s locations for New York City, USA. See the function
read_mcdonalds_nycfor more informationExample:
from cartoframes.examples import example_context
df = example_context.read_mcdonalds_nyc()
-
read_nat(limit=None, **kwargs)¶ Historical homicide rates for the United States at the county level. See the function
read_natfor more informationExample:
from cartoframes.examples import example_context
df = example_context.read_nat()
-
read_nyc_census_tracts(limit=None, **kwargs)¶ Census tracts for New York City, USA. See the function
read_nyc_census_tractsfor more informationExample:
from cartoframes.examples import example_context
df = example_context.read_nyc_census_tracts()